
|
After four weeks, enough games have been played for our OPR to give an accurate representation of team strength. Leading the way are Green, Schmidt, and Peacock, with Cliburn, Schuster, and Musselman bringing up the rear.
1 Comment
We are one month away from the OIL's 14th season. Fifty-four managers have competed since the first season in 2006. Forty-two of those 54 currently compete in the OIL. Eleven of the 42 have won at least one championship. Three of those 42 are defending conference champions (Brosh, Pyle, and Buehre). One is the defending OIL champion (Brosh). Below are the current OIL managers sorted by career OIL Power Rating.
Congratulations to all 18 playoff contenders. There were some incredibly tough breaks (such as Duffy losing two games by a combined 0.15 points or Tadlock missing the playoffs despite having the second-most points in the PFC), but that's the way the cookie crumbled. Pennington set the record for most points in a season while Rogers sadly broke the record for most losses (with an 0-13 record).  The final OPR rankings are below. Pennington topped the league but fell just short of setting the record for best OPR (1.297 in 2010 by the Arrogant Americans). The top 10 is comprised of four NFC teams and three each from the AFC and PFC. 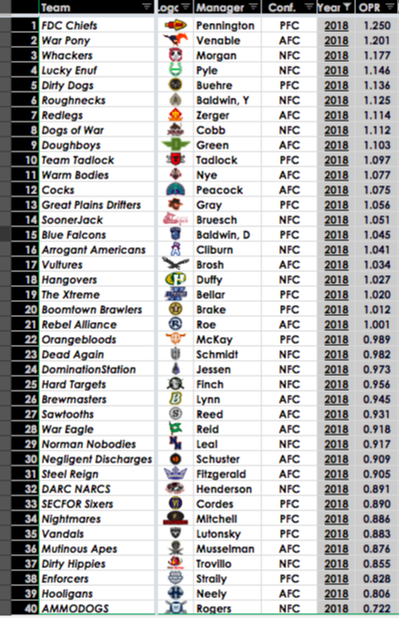 Heading into Rivalry Week, a whopping 12 of 18 playoff berths are clinched. Below are the standings and playoff picture for each conference.  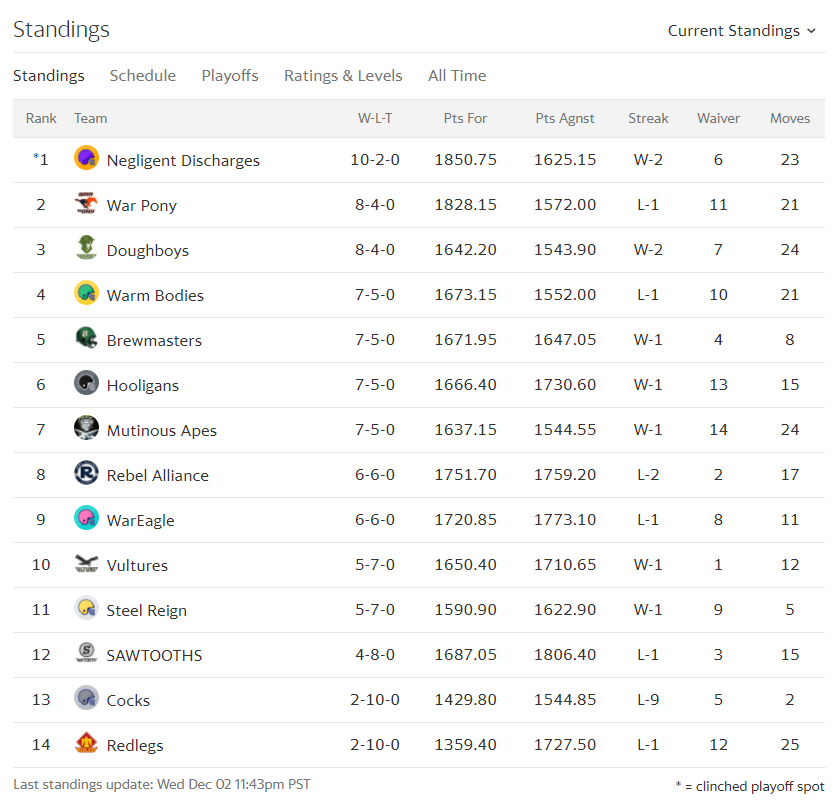 Well, this is a first. With one week remaining, all six playoff spots are clinched. Now all that is left is the seeding. Venable and War Pony are locked into the one seed and a first-round bye. The number-two spot is a toss-up between Green and Peacock, as the Doughboys and Cocks are separated by just 13 points. Should each of them win, it will come down to their point totals to determine who gets a coveted first-round bye. The Warm Bodies and Vultures each sport the same 8-4 record as the second- and third-place teams, but Nye and Brosh are so far behind in points that neither can overtake Green and Peacock. The six seed is Zerger and his two-time defending champion Redlegs. With a win and losses by three of the four teams ahead of him (aside from Venable), he can finish as high as third due to his high point total.
Just before the 2017 season, the OIL introduced the OIL Power Rating (OPR) system. Today, the OPR has evolved in a way that makes it easier to compare apples to apples across all conferences and all seasons. The formula and full explanation are available year-round at okiraqi.org/opr. The Adjusted OPR takes your team's OPR and divides it by the average OPR of all teams across each conference. The result is a multiple that illustrates exactly how your team stacks up to the baseline, perfectly average team. Below are the current OPR rankings under the new system. The FDC Chiefs' score of 1.243 means Pennington's squad is about 1.25 times stronger than the perfectly average, baseline team. Anything over 1.0 indicates an above-average team; anything below 1.0 indicates a below average team. 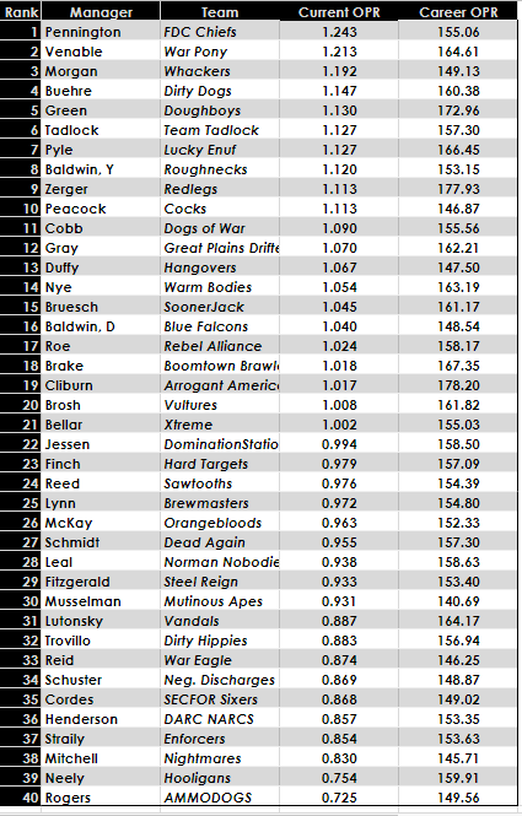 As of now, career OPR still lists the raw score, but that will change soon. The adjusted OPR has been added to each manager page for each season played as well. Below is Pyle's manager page, evidencing the following: In 2012, Lucky Enuf finished 6-7 and missed the playoffs. But was his team bad or just unlucky? His raw OPR was 172.07, while the average for 2012 was 155.32. Applying the adjusted OPR formula (172.07/155.32) shows that Lucky Enuf was 1.108 times better than the average 2012 team. An adjusted OPR of 1.108 indicates that Lucky Enuf was one of the stronger teams in the league that season but fell victim to a tough schedule (for comparison, the 2012 champion's adjusted OPR was just a tick higher at 1.133). 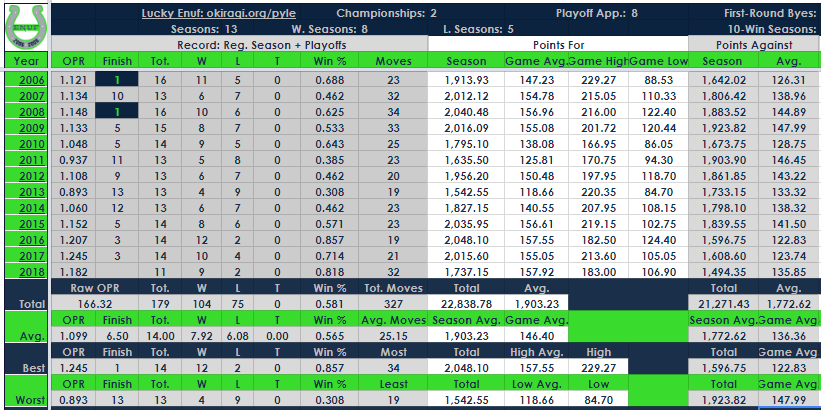 And the adjusted score makes it easier to compare seasons. Henderson's manager page is instructive. In 2013, his DARC NARCS finished with a losing record and missed the playoffs. In 2015, they won 11 games and finished second in the NFC. But, compared to the average team of each respective season, the 2013 DARC NARCS were a better team than the runner-up 2015 version, even while having a winning percentage 20+ points worse than 2015 (winning percentage is weighted at 20% of the OPR raw score). 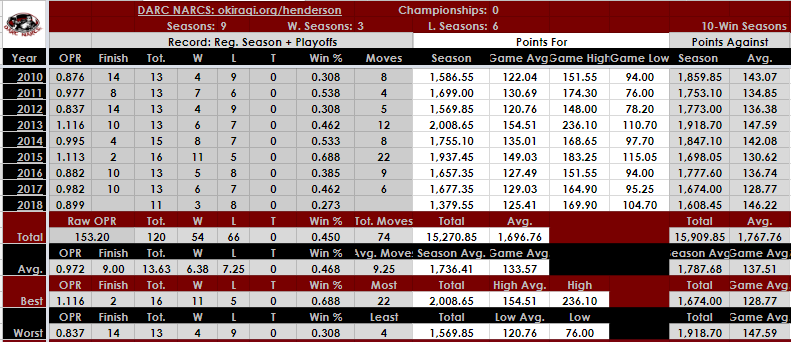 So check out your manager pages and enjoy comparing apples to apples.
There's a new number one in OPR, as the PFC's FDC Chiefs now sit atop the entire league. 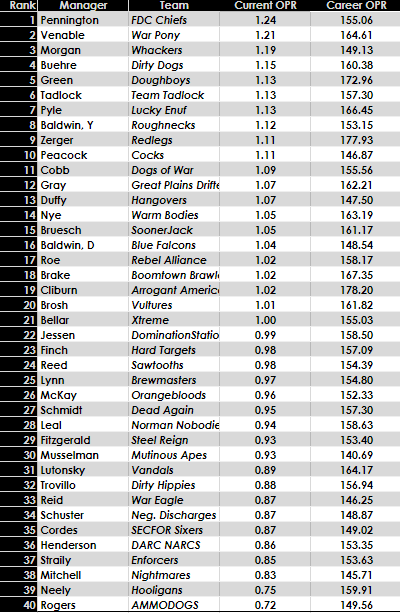 Of the 10 strongest teams by OPR, three are in the AFC, three are in the NFC, and four are in the PFC. 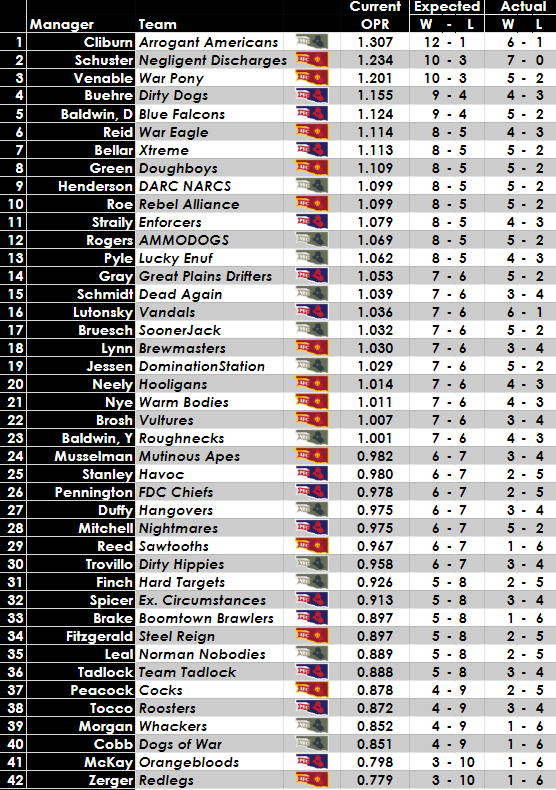 With Pyle's last-minute loss to Finch, there are only two unbeaten teams remaining in the OIL (and both of them were auto-drafted). On the flip side, Rogers remains the only OIL team without a win as his nightmare season continues. Below the standings is the current OPR for each team. The top 10 features two AFC teams, four NFC teams, and four PFC teams. 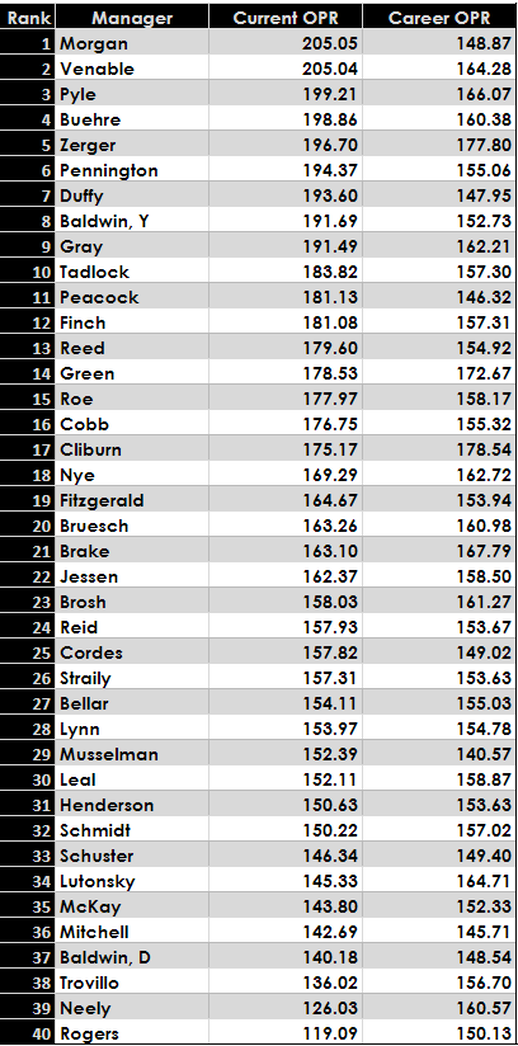 One advantage to adding the OPR to the OIL spreadsheet is that we can now more easily compare managers from one conference against another. Below is a ranking of all OIL teams heading into Week Six (Spicer and Stanley took over teams mid-season, so theirs are not being included). 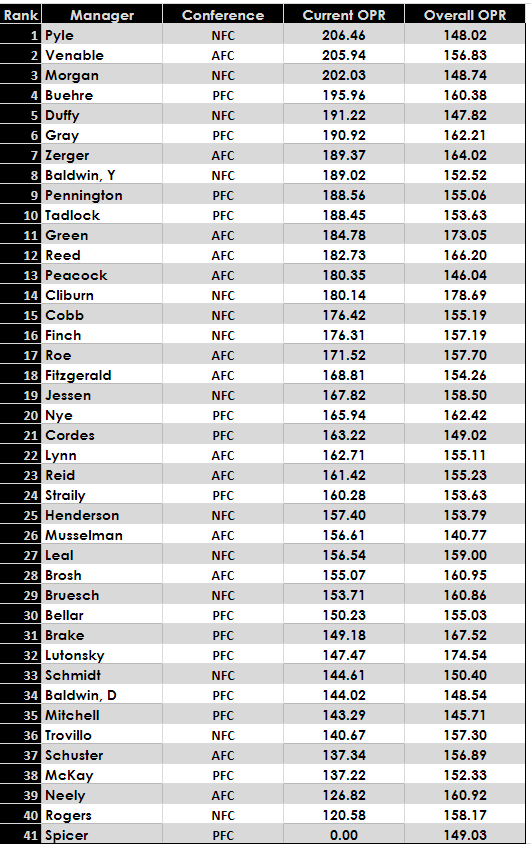 
The OIL Record Book spreadsheet now includes overall power ratings for each manager, as well as a power rating for each of their seasons. You can view a manager's overall power rating and their top-rated and lowest-rated seasons (2010-present) on the main Manager Rankings spreadsheet. On each manager's spreadsheet, you can view the power rating for every season, the average power rating (2010-present), and the top-rated and lowest-rated seasons (2010-present).
The power rating was created by the Oberon Mt. Fantasy Football League and has been featured on ESPN's Fantasy Focus podcast. It is used by many leagues across the country. Read the formula creator's explanation and see how it applies to the OIL after the jump. |


For other amounts,
use the Donate button above 


Click for team mugs, hoodies, decals, and much more.

March 2023
All
|


 RSS Feed
The OklahomIraqis League
|
|